Data Analytic and Pipeline
What is Data Science?
Pipeline
-
Sample Collection
- Effectively sample real-world data
-
Practical Motivation
- Identify and frame as a data science problem
-
Data Preparation
- How to prepare raw data for analysis?
- Data cleaning
-
Problem Formulation
- How to construct the problem intelligently?
-
Exploratory Analysis
- How to gain insights from data?
-
Statistical Description
- How to represent the data numerically?
-
Analytical Visualization
- How to present data meaningfully to humans?
-
Pattern Recognition
- Identify structures and find intrinsic insights from data
-
Algorithmic Optimization
- Developing effective learning algorithms
-
Machine Learning
- How to learn patterns from data?
- Training a model
-
Information Presentation
- Communicate data analysis effectively
-
Statistical Inference
- How to draw confident conclusions from data?
-
Ethical Consideration
- Does the data analysis conform to ethical values?
-
Intelligent Decision
-
Solving real-world problems with results
-
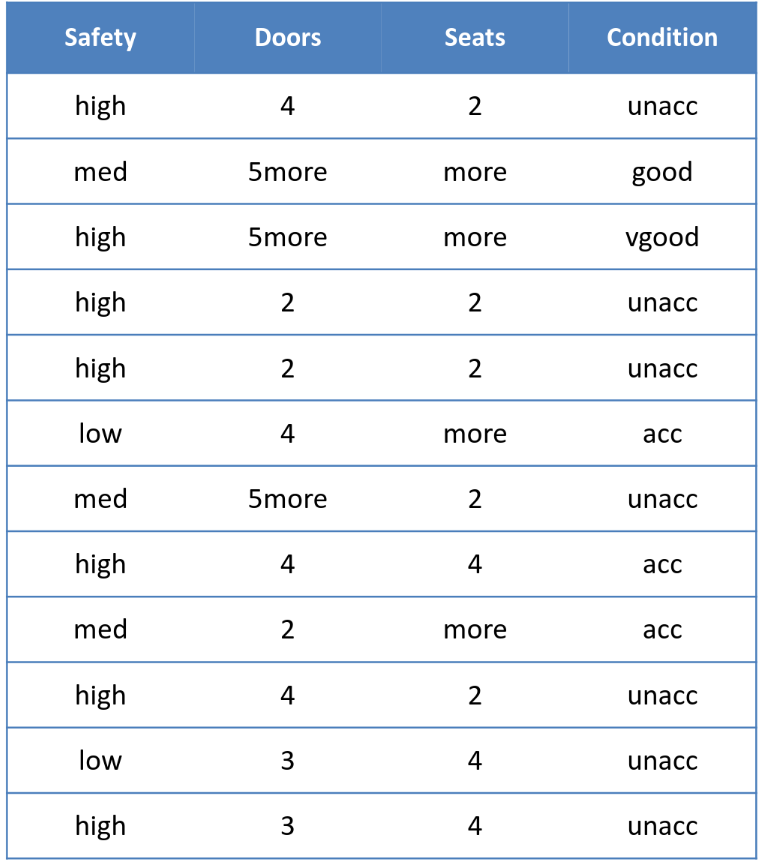
Data Types
Structured Data
-
Numeric Data
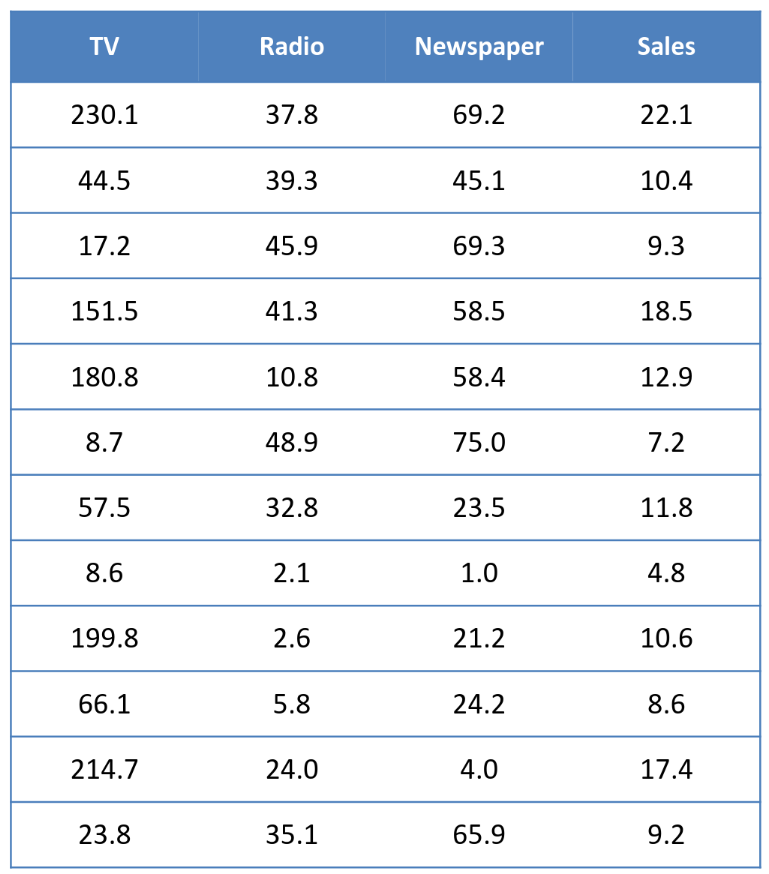
-
Categorical Data
-
Mixed Data
Numeric and Categorical
-
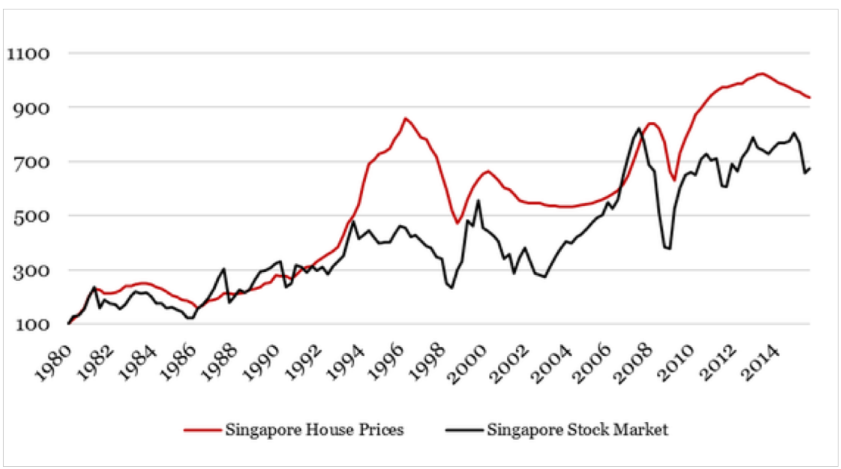
Time series Data
-
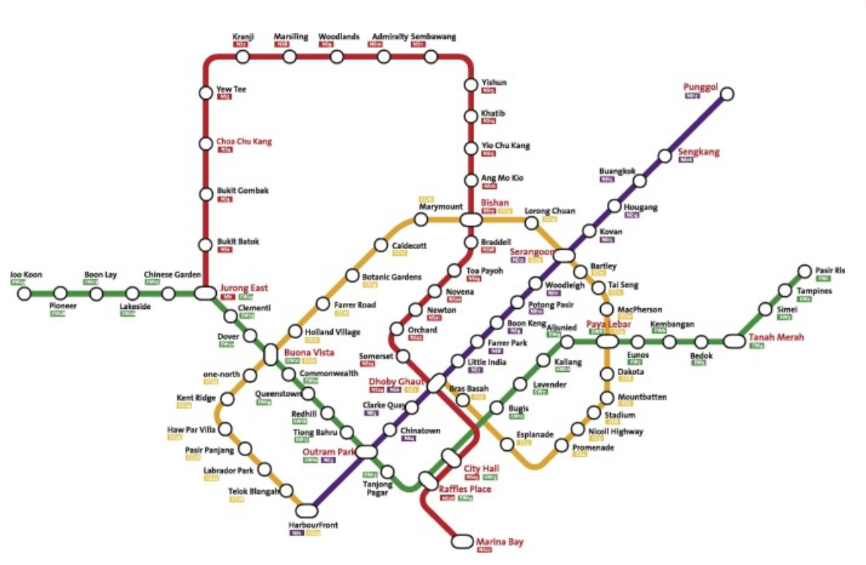
Network Data
Nodes and Connections
Unstructured Data
- Text Data
- Image Data
- Video Data
- Voice Data
Data Science Problems & Solutions
- Prediction: Numeric
- How Much? How Many
- is it profitable to make a sequel? Solution: Regression Linear regression models | Tree Models for Regression | Neural network for Regression
- Prediction: Class
- Type A or Type B
- Probability of admitting to NTU? Solution: Classification Logistic regression | Tree Model for Classification | Neural Network for Classification
- Detection: Structure
- How is this organised? Solution: Clustering Identifying groups of data points close together, and far from other groups, Without categories or labelling k-Means Algorithm for clustering | Hierarchical Model for Clustering
- Detection: Anomaly
- weird behaviours
- is the engine safe to operate? Solution: Anomaly detection Cluster-Analysis based Detection | Nearest Neighbour Detection Model | Support Vector based Detection
- Decision: Action
- what should be done next?
- which action will be rewarded? Solution: Adaptive learning Model a Profit/Loss Function Reinforcement learning Approach | Monte-Carlo, State-Action-Reward | Q-learning, Deep Reinforcement
Basic Statistics & Data Analysis
Uni-Variate Statistics
Data Available: Average Value | Deviation from Average | Maximum and Minimum
-
Central Tendencies (Mean)
Sum of data / Count of data
-
Dispersion: Standard Deviation
sum of deviation / count of data
-
Central Tendencies (Median)
-
Dispersion: Quantiles
Markers to divide the data 25:50:25
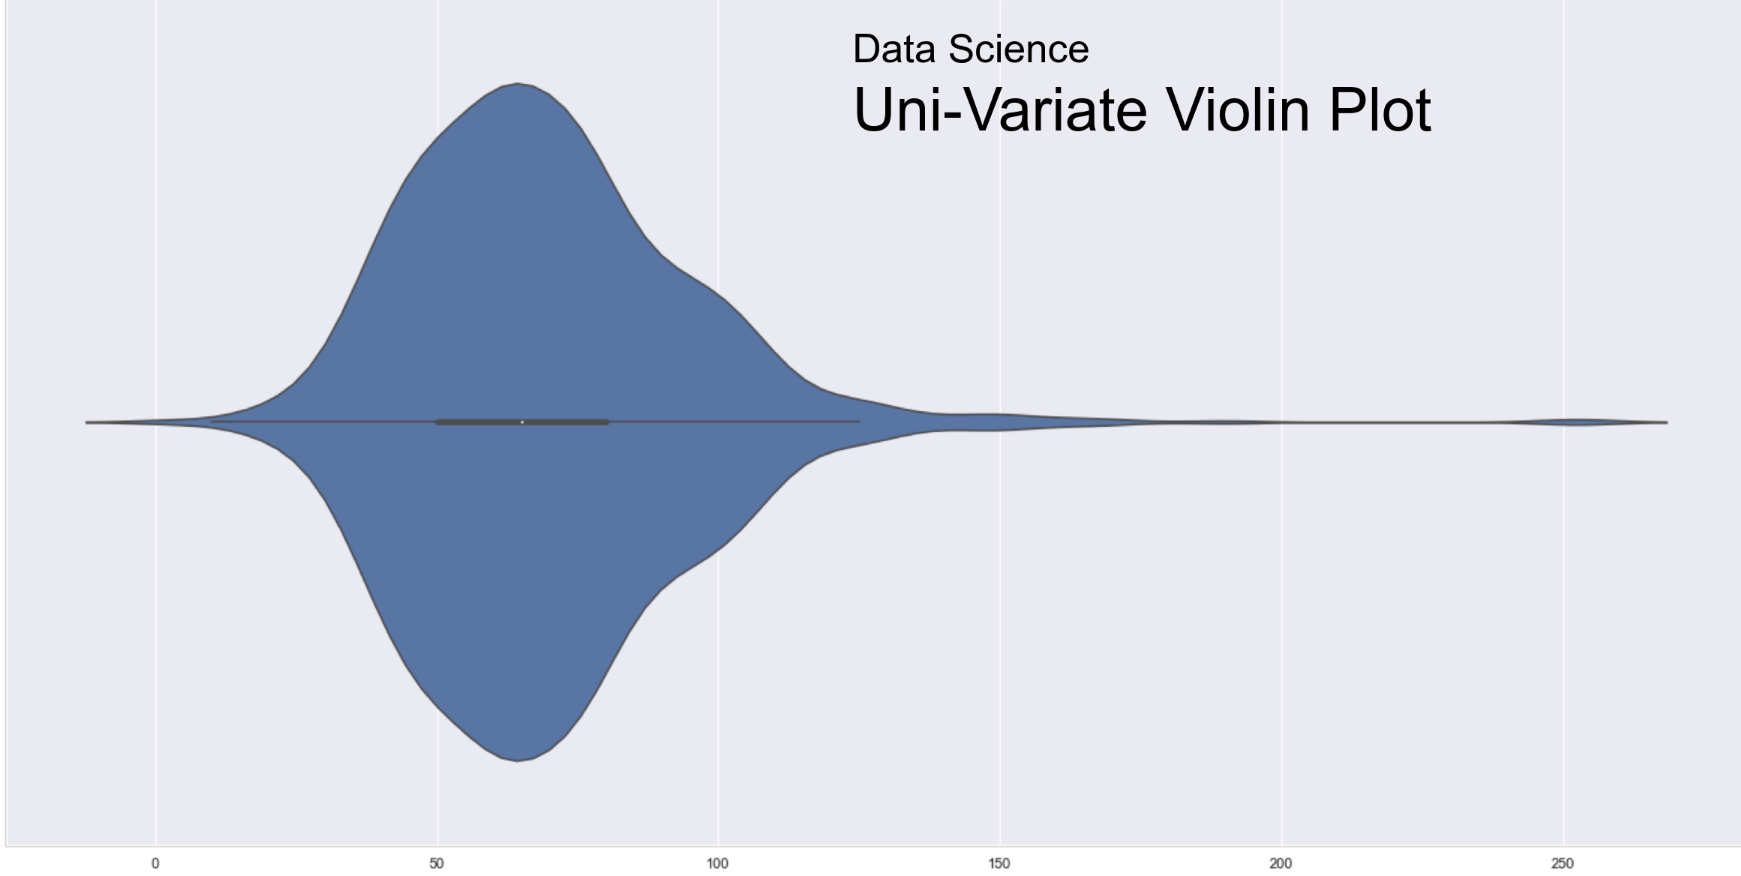
Uni-Variate Visualisation
Exploratory Analysis
-
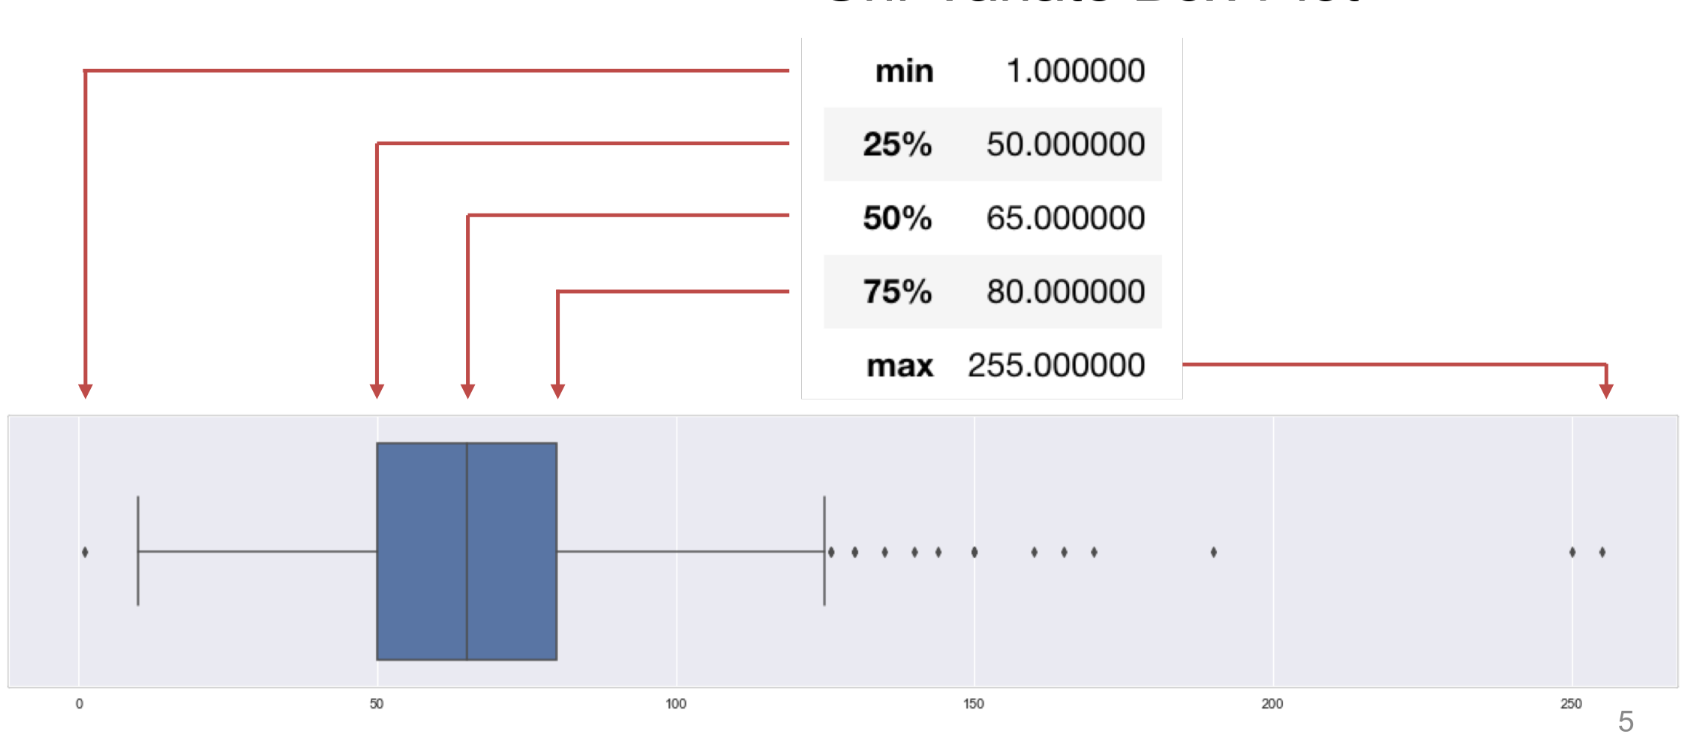
Box-Plot
Inter-Quartile range (IQR) - between 25% and 75%
Upper Whisker = 75% + IQR x 1.5
Lower Whisker = 25% - IQR x 1.5
-
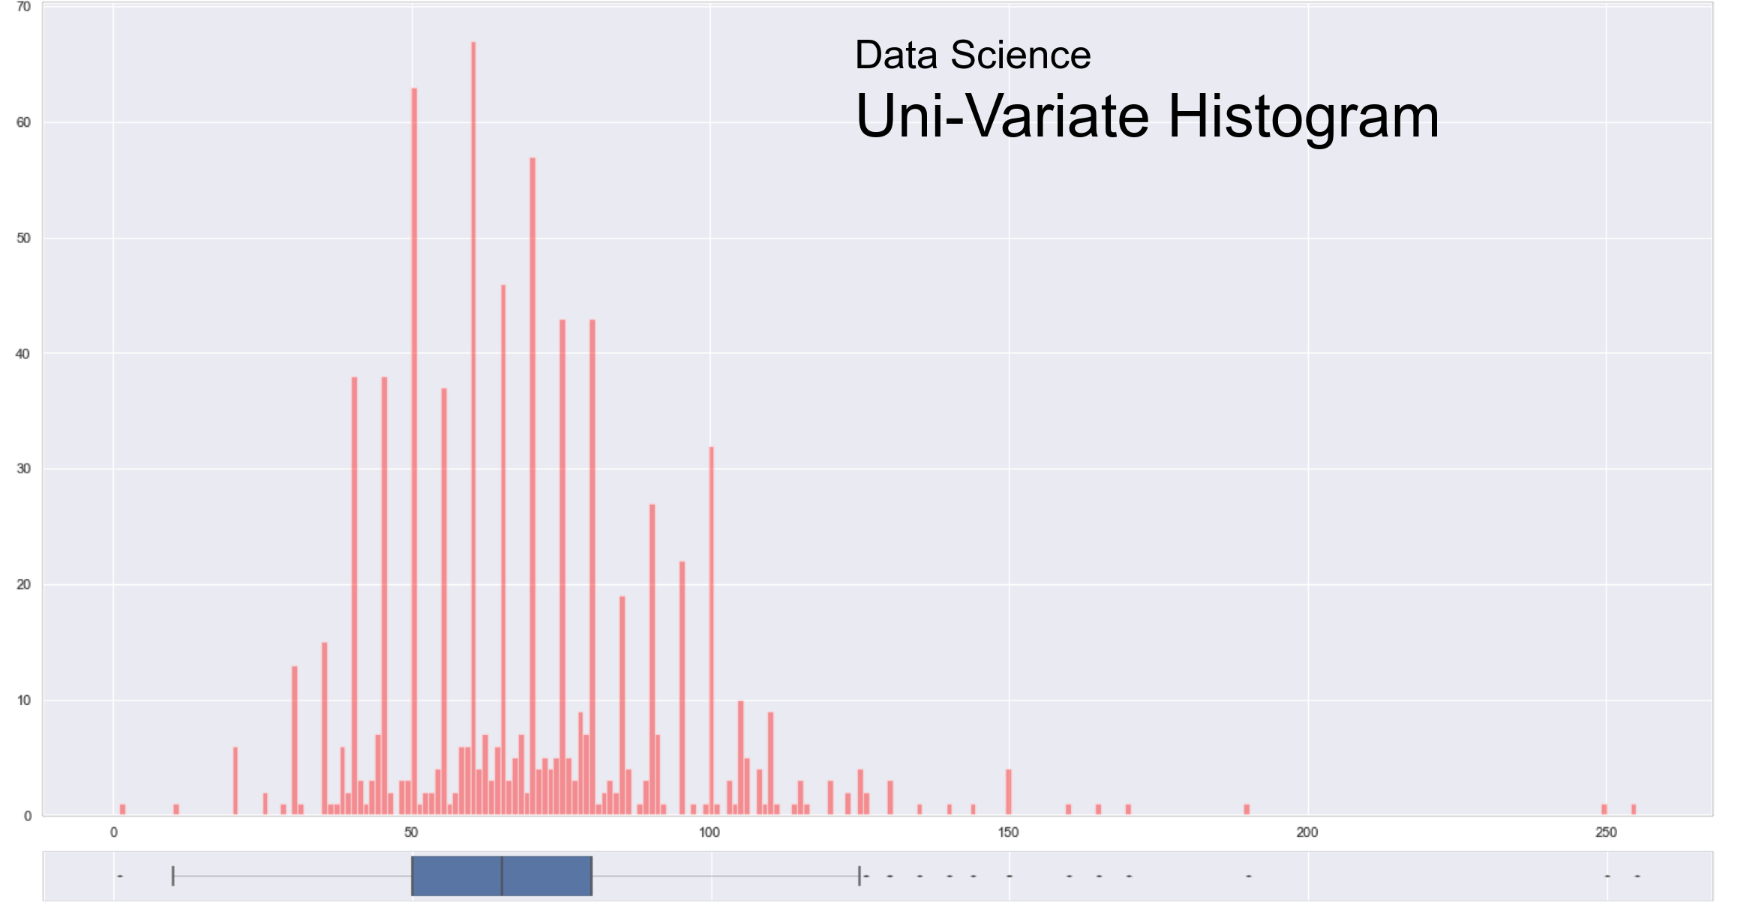
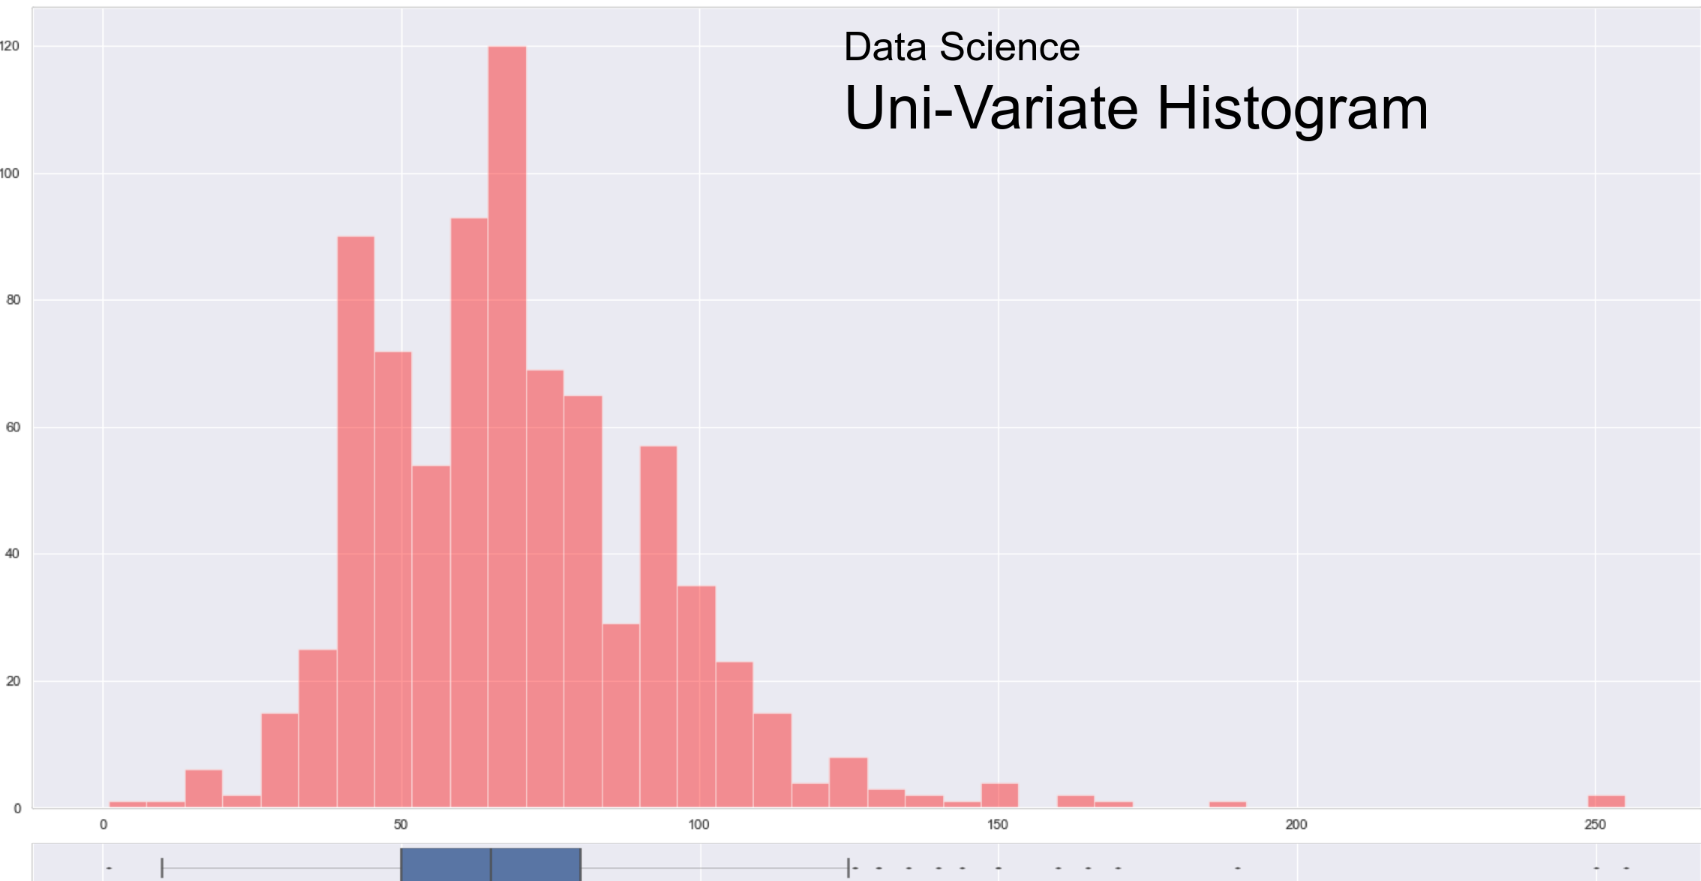
Histogram
-
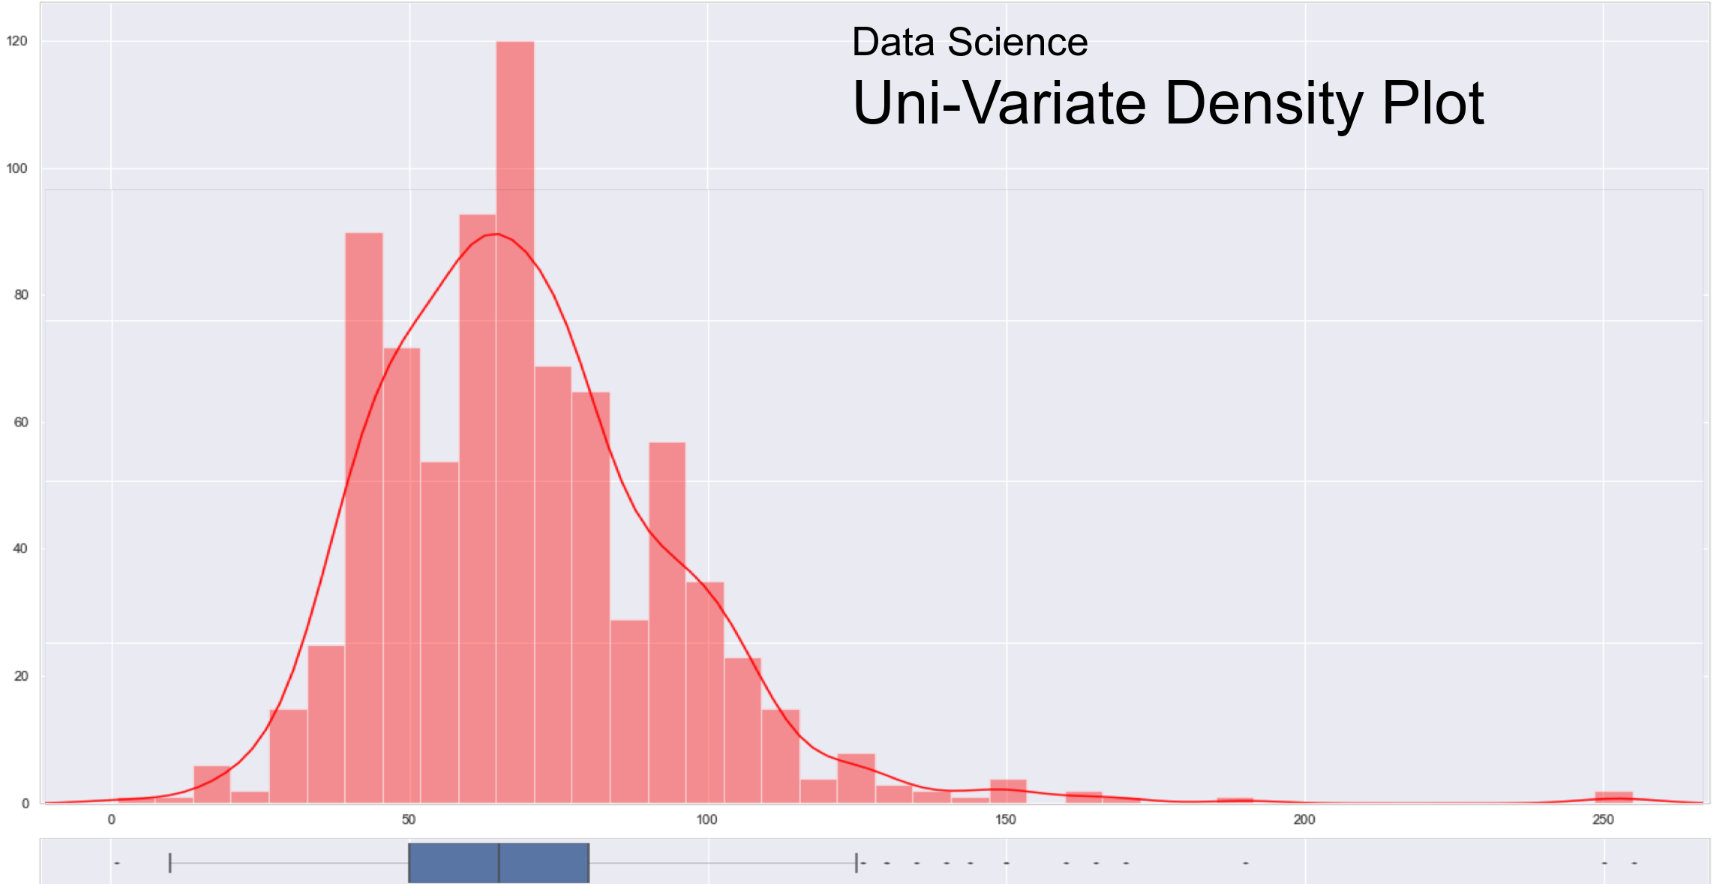
Density Plot
-
Violin Plot
Bi-Variate Exploration
-
Bi-Variate Joint plot
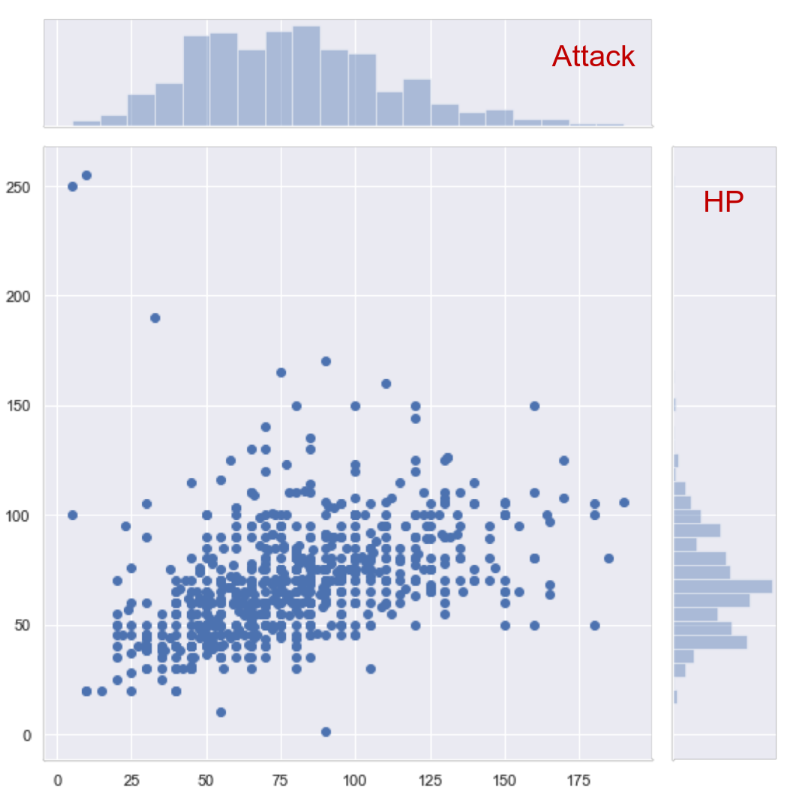
-
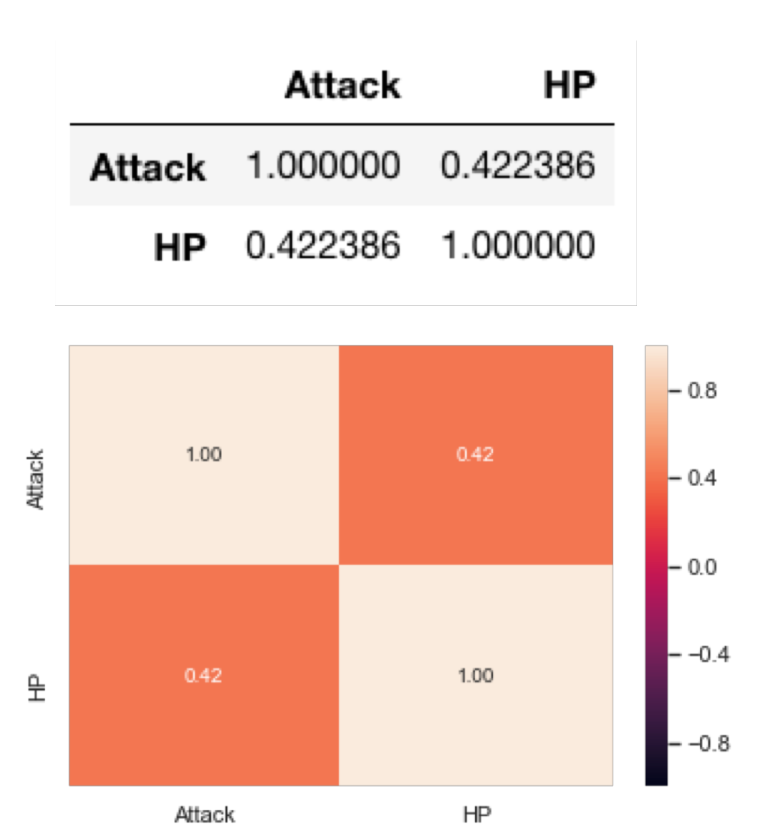
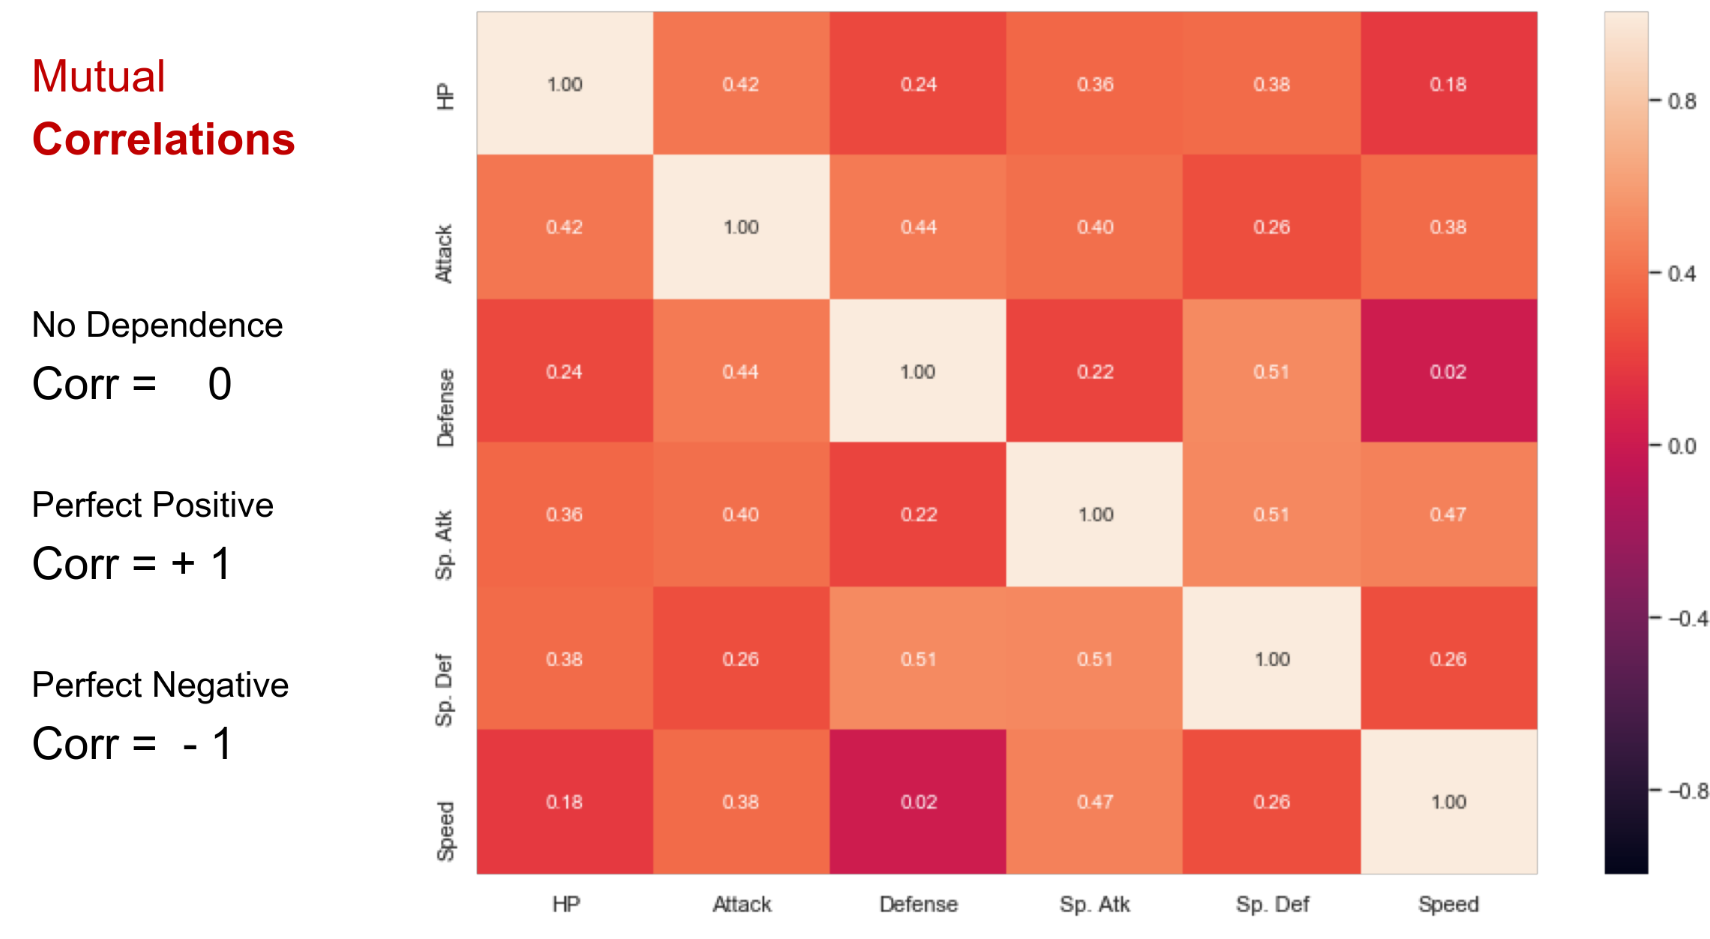
Correlation Coefficient
Co-Variance / St. Dev Product
No dependence - Corr = 0
Perfect positive - Corr = 1
Perfect negative = Corr = -1
-
Correlation Matrix & Plot
Multi-Variate Exploration
-
Mutual Correlation and Plots
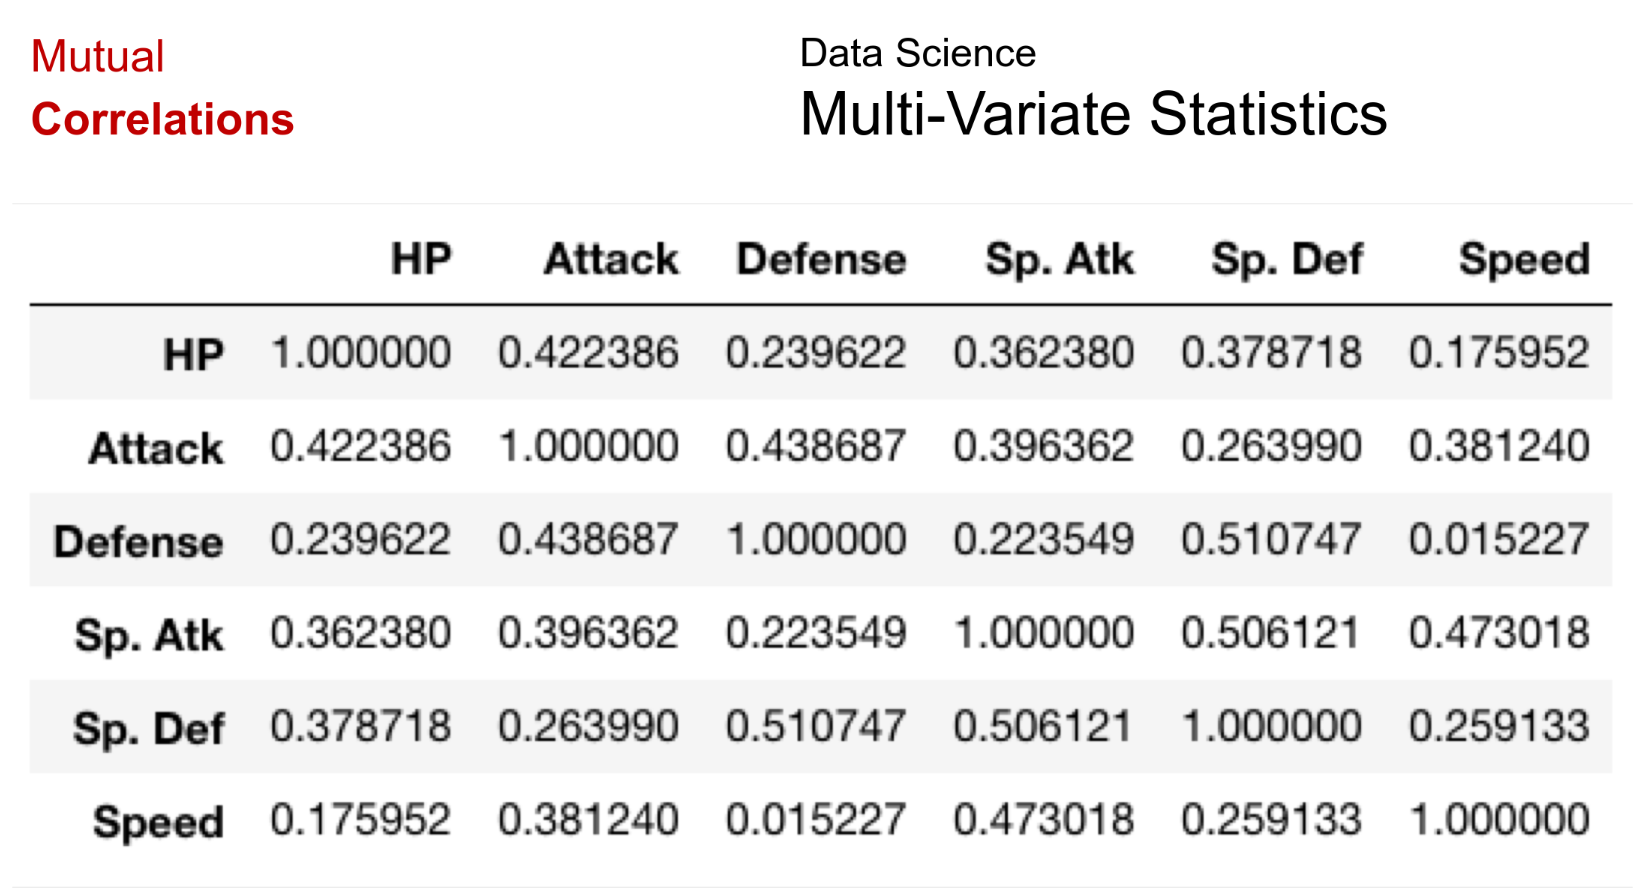
-
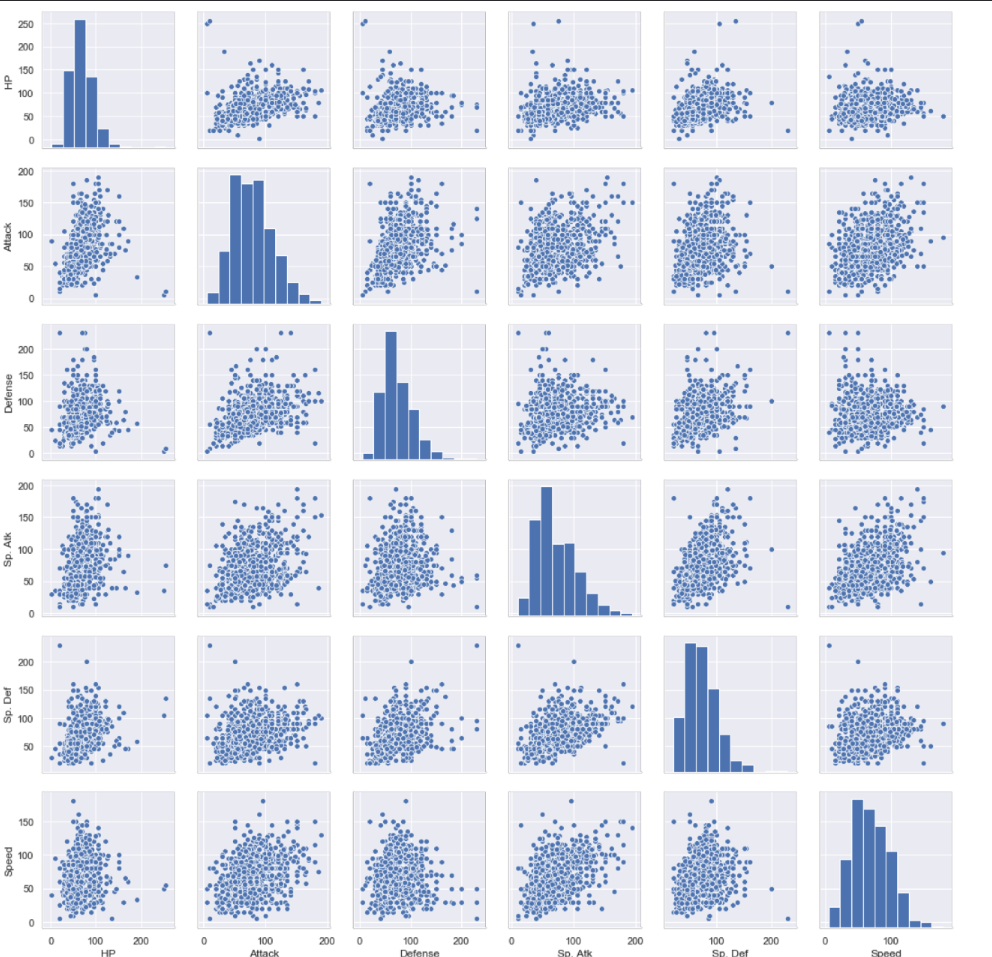
Multi-Variate Pair Plot
Basically mega joint plots
Linear regression
Machine learning
Building a prediction model
-
Given - Variables
-
Learn - Model for desired value
-
Predict - Desired value for others
-
Supervised Learning
Regression | Classification
-
Unsupervised Learning
Clustering | Anomaly Detection
Uni-Variate Linear Regression
Split the data set into:
-
(Train) - to train the model
-
(Test) - to test the model Using (Train):
-
Hypothesize a Linear model - Y = mX + C
-
Algorithmic Optimization
Minimise Cost Function to attain linear model (Best fit line)
-
Goodness of Fit of Model
Higher Explained Variance the better the model
==R^2 = 0 does not mean all predictions are incorrect==
Lower Mean Squared Error the better the model
Decision Tree & Classification
Binary Classification
Prediction of Class with an Independent variable
-
Box and Swarm plot
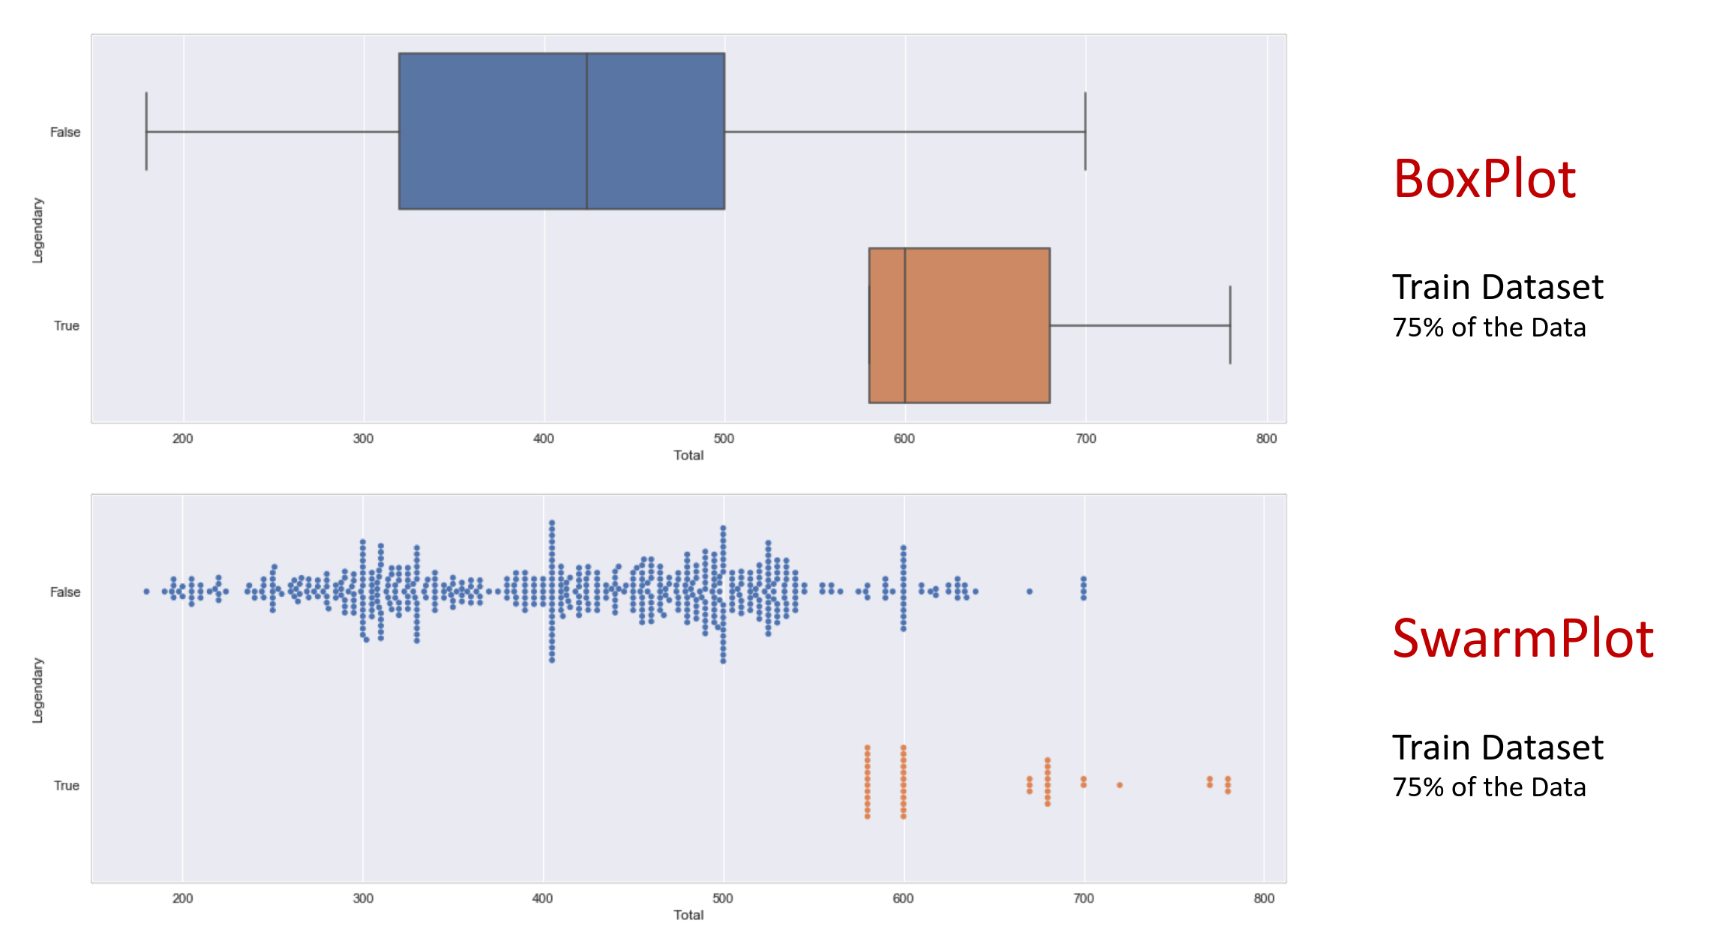
-
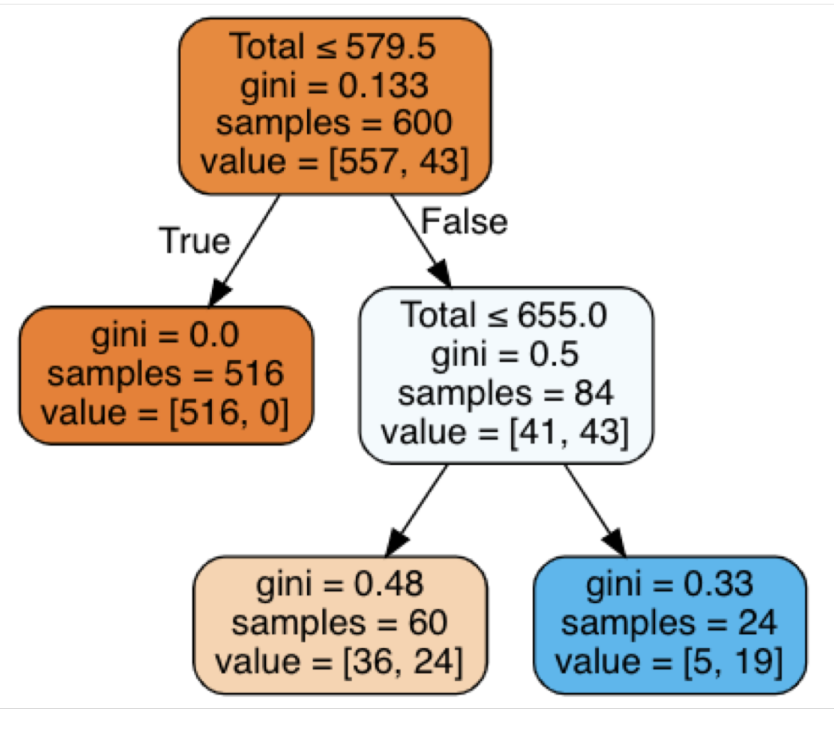
Decision tree algorithm
-
It repeatedly splits the dataset into subsets based on the feature
that minimizes impurity until it reaches a stopping criterion -
Leaf nodes: Final nodes in the decision tree
-
Setting a maximum depth helps prevent the tree from becoming
too complex and overfitting
-
Consecutive binary decision are made based on Gini Index - Measurement of impurity
-
Confusion Matrix
FN: False negative - true predict as false
FP: False positive - false predict as true
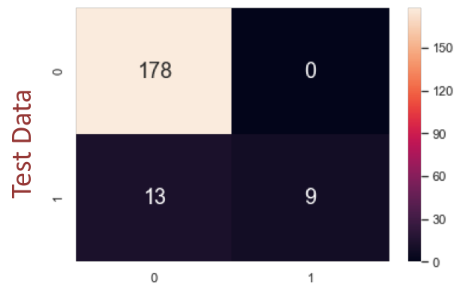
Recall = True positive rate Precision = Positive Prediction Accuracy
Clustering
Clustering Patterns
- K-Means Clustering Algorithm
- To minimize the sum of squared distances between data points and their assigned cluster centroids
- Parameter: Choose K - potential number of clusters
- Poorly chosen K means non-meaningful clusters
- Initialisation: Choose K cluster centroids from the dataset
- Iteration:
- for each point in the data set - Re-label according to nearest centroid
- for each cluster of data points - Re-compute centroid of cluster
Anomaly Detection
-
Local Outlier Factor (LOF)
- It compares the local density of a point with that of its neighbours to detect anomalies
- High LOF - point density is smaller compared to neighbours
- Parameter
- Choose K - number of neighbours to “scan” for
- Iteration - for each point in data set
- find the K nearest neighbour in data (scan)
- compute the local density by comparing distance between point and neighbours
-
Visuals
-
Computation:
Reachability distance (RD) - distance between point and neighbour
Local Reachability Density (LRD):
LOF score:
Visualisation and Presentation
To communicate complex data insights in a clear and effective manner
-
Visualisation elements ranking (Accurate - Generic)
Length (Aligned) | Length | Slope & Angles | Area and Colour Intensity | Volume | Colour hue
-
Data Ink VS Non-data Ink
- “Ink” that presents actual useful data VS “Ink” for aesthetics and formatting
- Ratio should be as high as possible